Luminant Analytics´ Benchmark Loss Frequency Projections for Commercial Auto Liability
Luminant Analytics offers benchmark frequency projections for commercial auto liability, based on data from government and other third-party public sources. The intent of this offering is to:
1) Assist carriers in making decisions beyond what is supported by mostly internal data, and
2) Offer prospective predictions based on econometric models, to translate raw data into usable forecasts.
Commercial auto profitability has been poor across the industry and we hope these analytics will assist companies in generating stronger returns going forward.
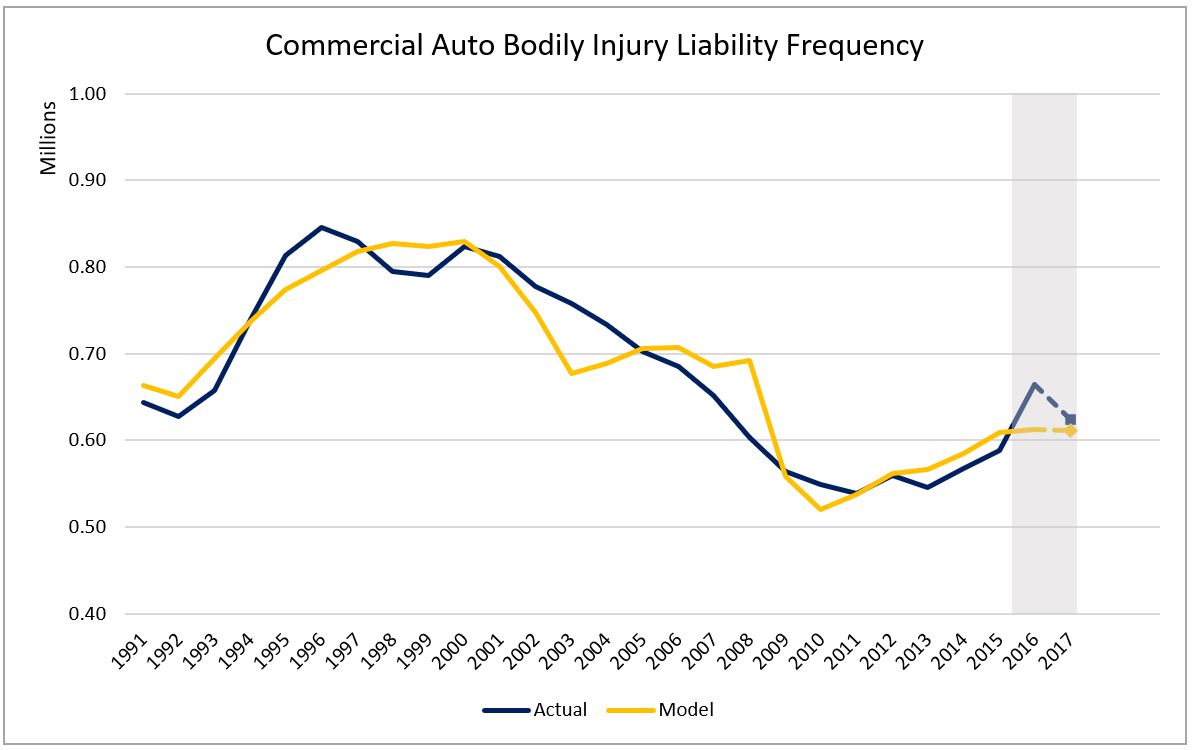
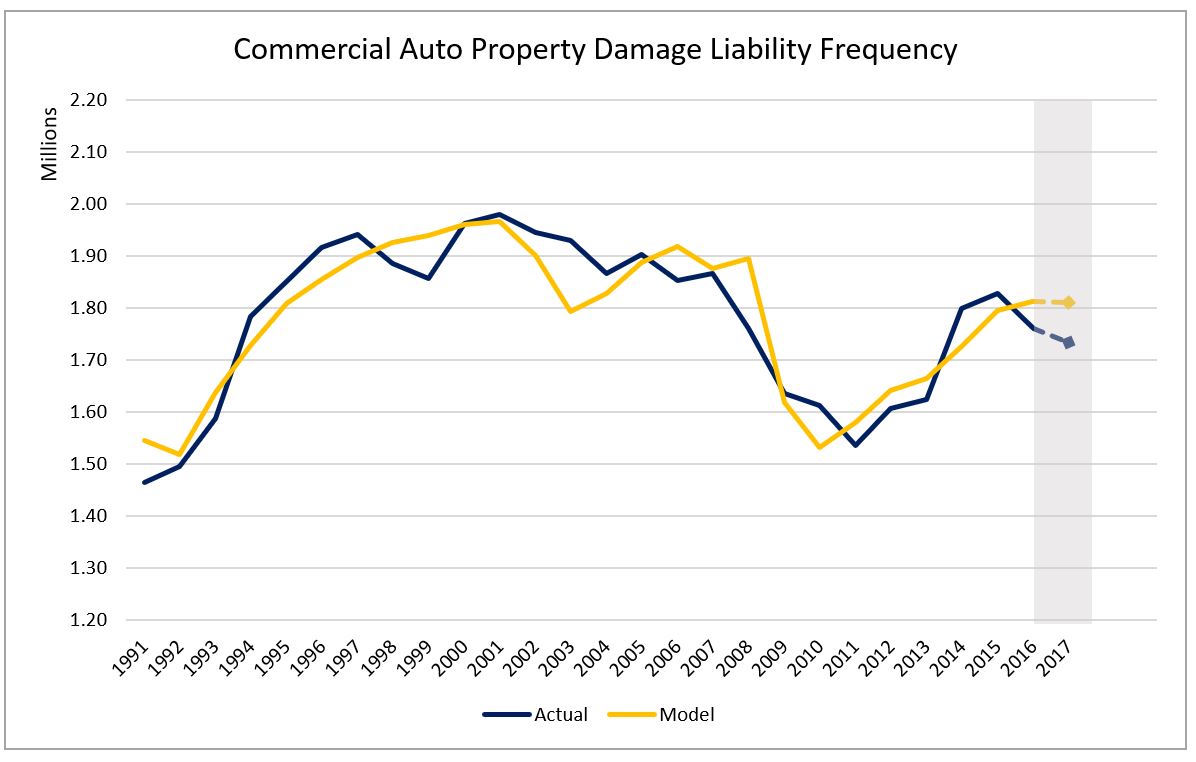
Below are Luminant Analytics´ loss frequency projections for Bodily Injury (BI) Liability and Property Damage (PD) Liability for commercial auto, country-wide from a blend of external data sources, appropriately curated and modeled. These projections below stop at 2017, but you will be able to purchase the projections for 2018, 2019 and 2020 by clicking on I want to order projections.
Back-tested model results are displayed in the graphs below.
Definitions
Commercial auto: includes light, medium, heavy, extra-heavy trucks, heavy truck tractors, buses and limousines.
Bodily injury accidents: These refer to accidents that involve at least one vehicle that is categorized as a commercial auto vehicle, which result in either a death or injury, independent of whether there is property damage involved.
Property damage accidents: These refer to accidents that involve at least one vehicle that is categorized as a commercial auto vehicle, which result in only property damage, but no injuries or deaths.
- The blue line represents the actual number of accidents.
- The yellow line represents the model-predicted accidents.
- The actual inputs stop at 2016, with 2017 representing an unbiased prospective forecast as indicated by the dotted line in the shaded region.
- The in-sample R-squared for the BI model is 87.9% and for the PD model is 84.5%.
We also offer alternate projections in case the economy goes through a moderate recession. We are working on state-specific loss frequency and severity projections, by high-level categories of vehicles (medium vs. heavy trucks as an example). If you are interested in a particular US state and/ or a particular vehicle type, please reach out to us at reachout@luminantanalytics.com.
Offering
| Economic scenarios offered | 1. Current 2. Moderate Recession |
| LOB | Commercial auto |
| Source | Luminant Analytics |
| Delivery frequency | Yearly |
| Geography | United States; Countrywide |
| Begin Date | 1991 |
| Historical End Date | 2017 |
| Last date of actuals in backtesting | 2017 |
| Forecast period | 2018-2020 |
| Last Updated | 10/20/2019 |
- Current: This is the scenario that is generated when existing social, economic, political and legal trends persist without unforeseen disruptions.
- Moderate Recession: We refer to the Moody´s Analytics´definition of what constitutes a moderate recession.
Disclaimer: Luminant Analytics does not forecast economic scenarios, and our loss frequency projections are subject to risks, assumptions and uncertainties that could cause actual future results to differ materially from such projections.
Statistical Performance of Model
We report the in-sample R-Squared measure. This measures how good the model fits the actual data for 1991-2017.
- Method 1: Standard prediction interval for the model for the forecasted year.
- Method 2: Weighted prediction interval for the model for the forecasted year, accounting for increasing uncertainty over future years.