It has been a rough few years for the US auto insurance market, and recent activity on America´s roads does not seem to support a quick rebound. The National Association of Insurance Commissioners (NAIC), which is the regulatory support authority for the US insurance market, reports that in 2016, auto insurance alone contributed to roughly 40% of the Direct earned premiums generated by the $600 billion US Property & Casualty (P & C) industry. The segment has been profitable as captured by the lower than industry average loss ratios, particularly for commercial auto in the early 2000s. But that trend changed especially after the great recession. In fact, after 2011, auto loss ratios consistently rose, alongside diverging from the overall improvement experienced through of the P & C industry. For auto,2016 seems to be the worst performing year so far.
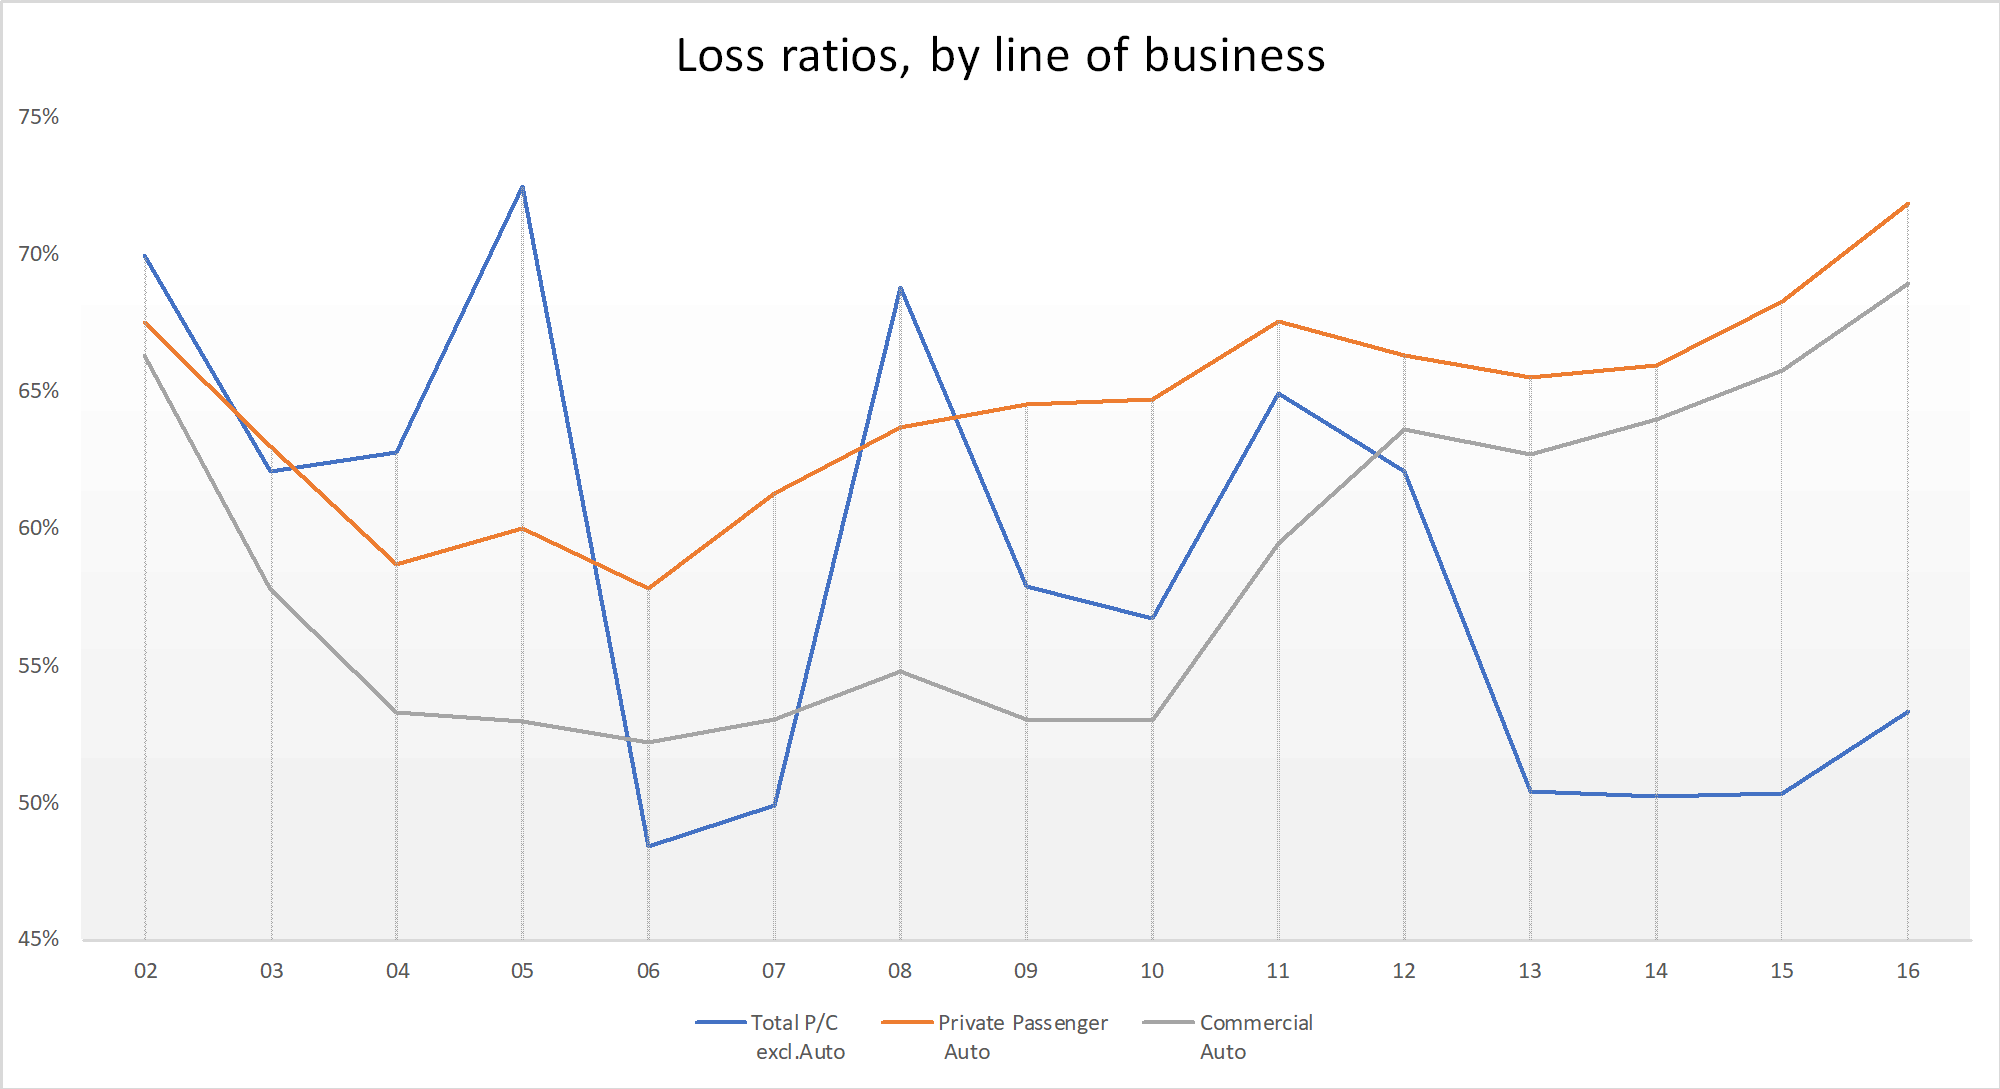
Source: Market share reports, 2005-2016, NAIC. NAIC does not endorse any analysis or conclusions based upon the use of this data.
There is however, indication that a quick turnaround may not happen. At least, that is what the most updated figures on US road fatalities seem to indicate. Most recent numbers from the National Highway Traffic Safety Administration´s (NHTSA) census of road fatalities also known as Fatality Analysis Reporting System (FARS )indicate more deaths on US roads. In fact, the absolute numbers recorded by this census of US road fatalities point to a new peak since the great recession of 2008-2009. 2017 provisional fatality estimates are slightly improved, but we will have to wait till the final numbers roll in for a decisive call on the situation.
The story from the normalized version of road fatalities is equally telling. Even after taking into account the increase in the vehicle miles traveled by US automobiles, the number of registered vehicles, or the growing population, road fatalities are certainly on the rise.
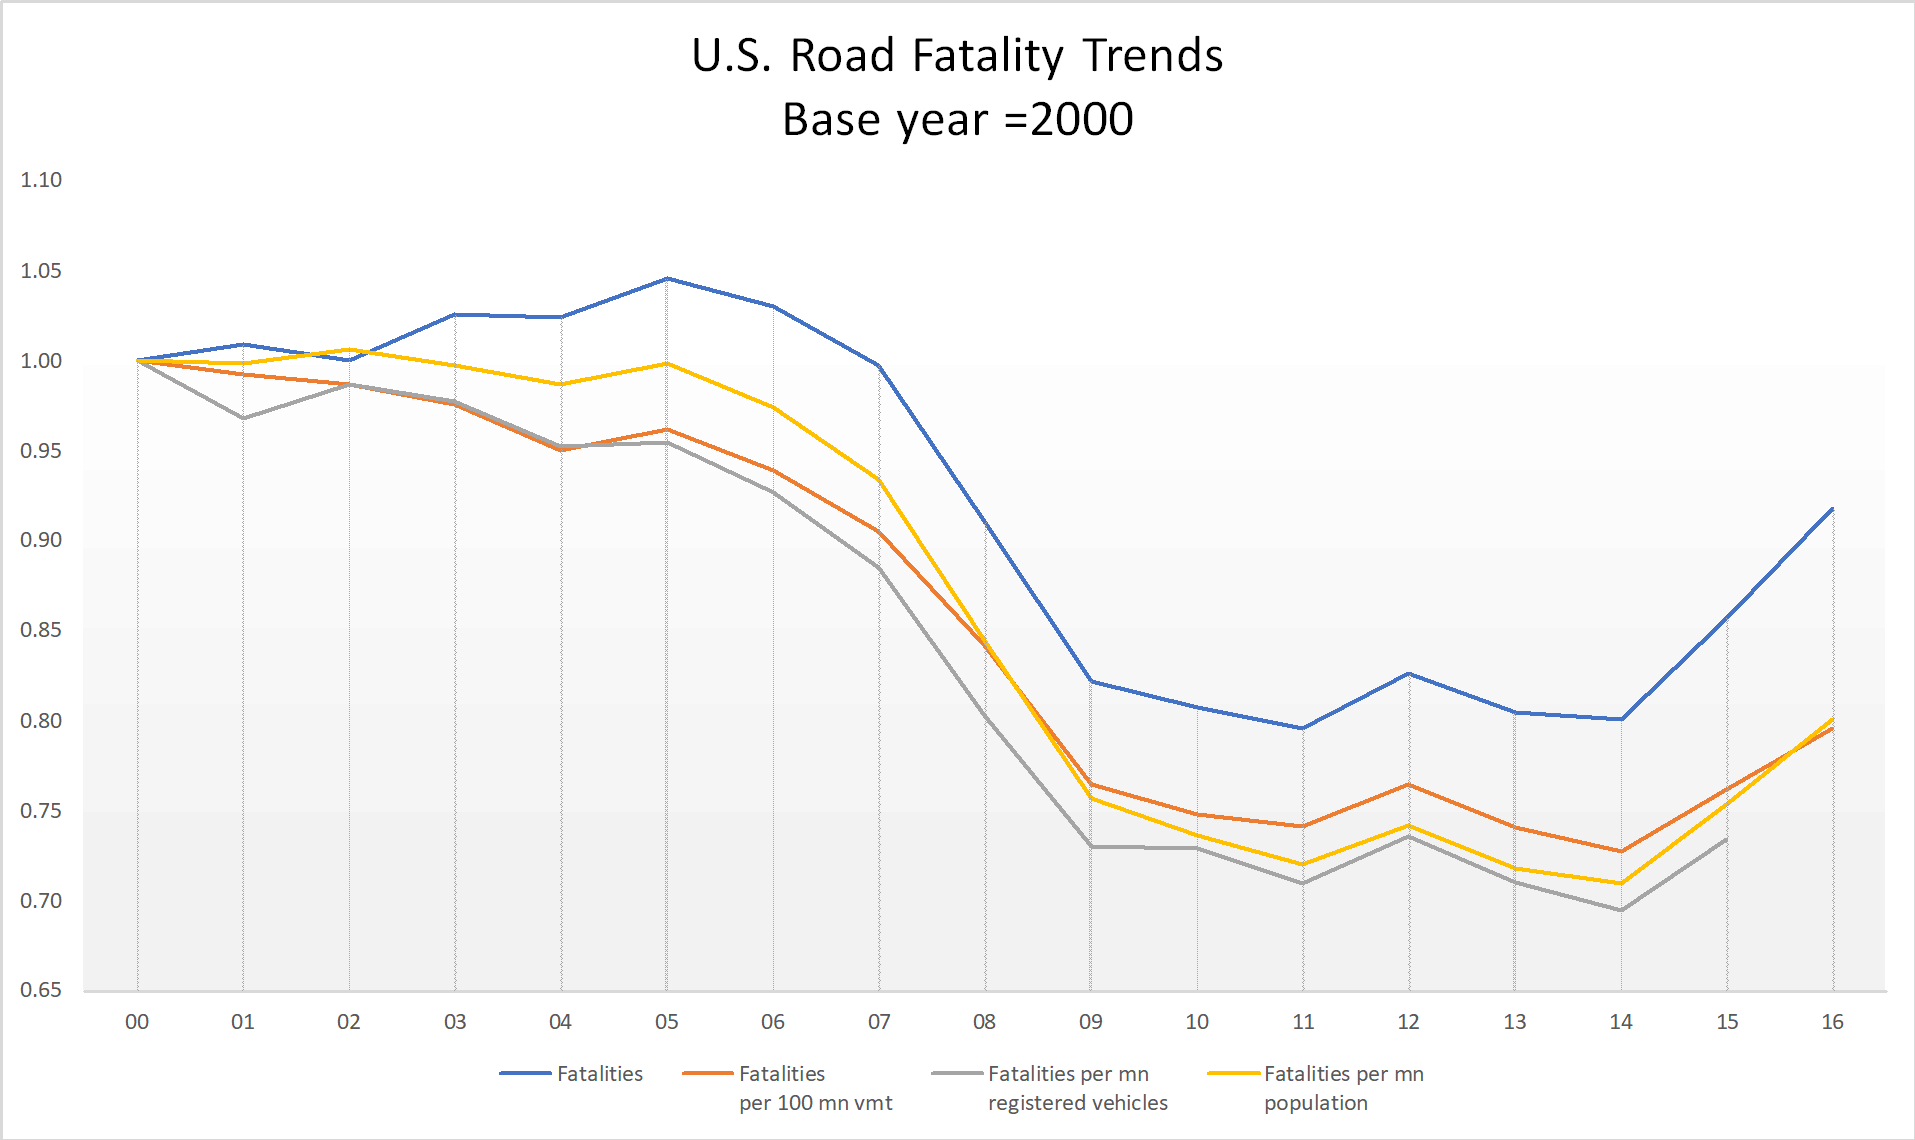
Source: Fatalities-FARS 00-16; Vehicle miles traveled (SA), Registered vehicles (Total highway)- US Bureau of Transportation Statistics, 00-16/15; Population-US Bureau of Census, 2000-2016
Rising fatality rates can explain only a part of overall losses. After all, total losses are determined by both a higher number of losses or claims (loss frequency) as well as larger claim values (loss severity). Increasing fatalities contribute to rising loss frequency, as do increased injury rates. Still, it is worth a second glance, because the sustained recent uptick in in fatalities has been a deviation from the downward trend of the early 2000s. What is making America´s roads deadlier than before? Answers or suggestions of answers to the question posed above will follow in the later blogs, and for further data insights, please visit our “Luminant Driven” dashboard. In the next article we will look at how fatality trends differ across the different regions and states ,whether additional factors impacting these trends can be gleaned from the regional analysis.
While insurers are figuring out how to stay profitable in light of the continued environment of unexpected losses, consumers are paying for the uncertainty-fraught environment through higher prices. Data from the Bureau of Labor Statistics shows that while overall inflation2 increased by 8.2% from 2007-2017, that for motor insurance increased3 by 44.5% in the same time period! With what we now know about road fatality trends, it seems as though auto insurance price hikes are here to stay.
- (1) Loss ratio= (Incurred losses / Earned Premiums ) * 100. They represent simple calendar year results, capturing the one facet of overall profitability.
- (2) CPI-U: All items in U.S. city average, all urban consumers, seasonally adjusted. Bureau of Labor Statistics, 2007- 2017
- (3) CPI- motor insurance: Motor vehicle insurance in U.S. city average, all urban consumers, seasonally adjusted. Bureau of Labor Statistics, 2007-2017